
[Quant] Alpha#101
업데이트:
Wilmott Magazine 2016(84) (2016) 72-80 [Paper]
Zura Kakushadze
In this post, we examine Alpha #101 from the paper’s collection of 101 formulaic alphas.
Formula
\[\frac{\text{close} - \text{open}}{(\text{high} - \text{low}) + 0.01}\]- close − open : How much did the price rise (or fall) during the day?
- high − low : How much did the price fluctuate during the day?
- + 0.01 : A small constant to prevent division by zero.
In essence, this alpha measures the efficiency of the move relative to volatility.
High alpha value →
- The price rose quietly, with little fluctuation.
- A steady, confident upward move — possibly conviction-driven buying.
Low alpha value →
- High intraday volatility relative to the net move.
- An unstable, noisy price action.
This alpha can serve as a useful signal for short-term trading or momentum screening.
Limitations
- The signal only looks at a single day’s OHLC data.
- It ignores all other information (volume, news, macro, etc.) and should be combined with other indicators.
- In a regime of high market-wide volatility, the interpretation may change significantly.
Experiment
Setup
| Parameter | Value |
|---|---|
| Universe | Top 30 stocks from the S&P 500 |
| Starting Capital | $1 |
| Period | 499 trading days (~2 years) |
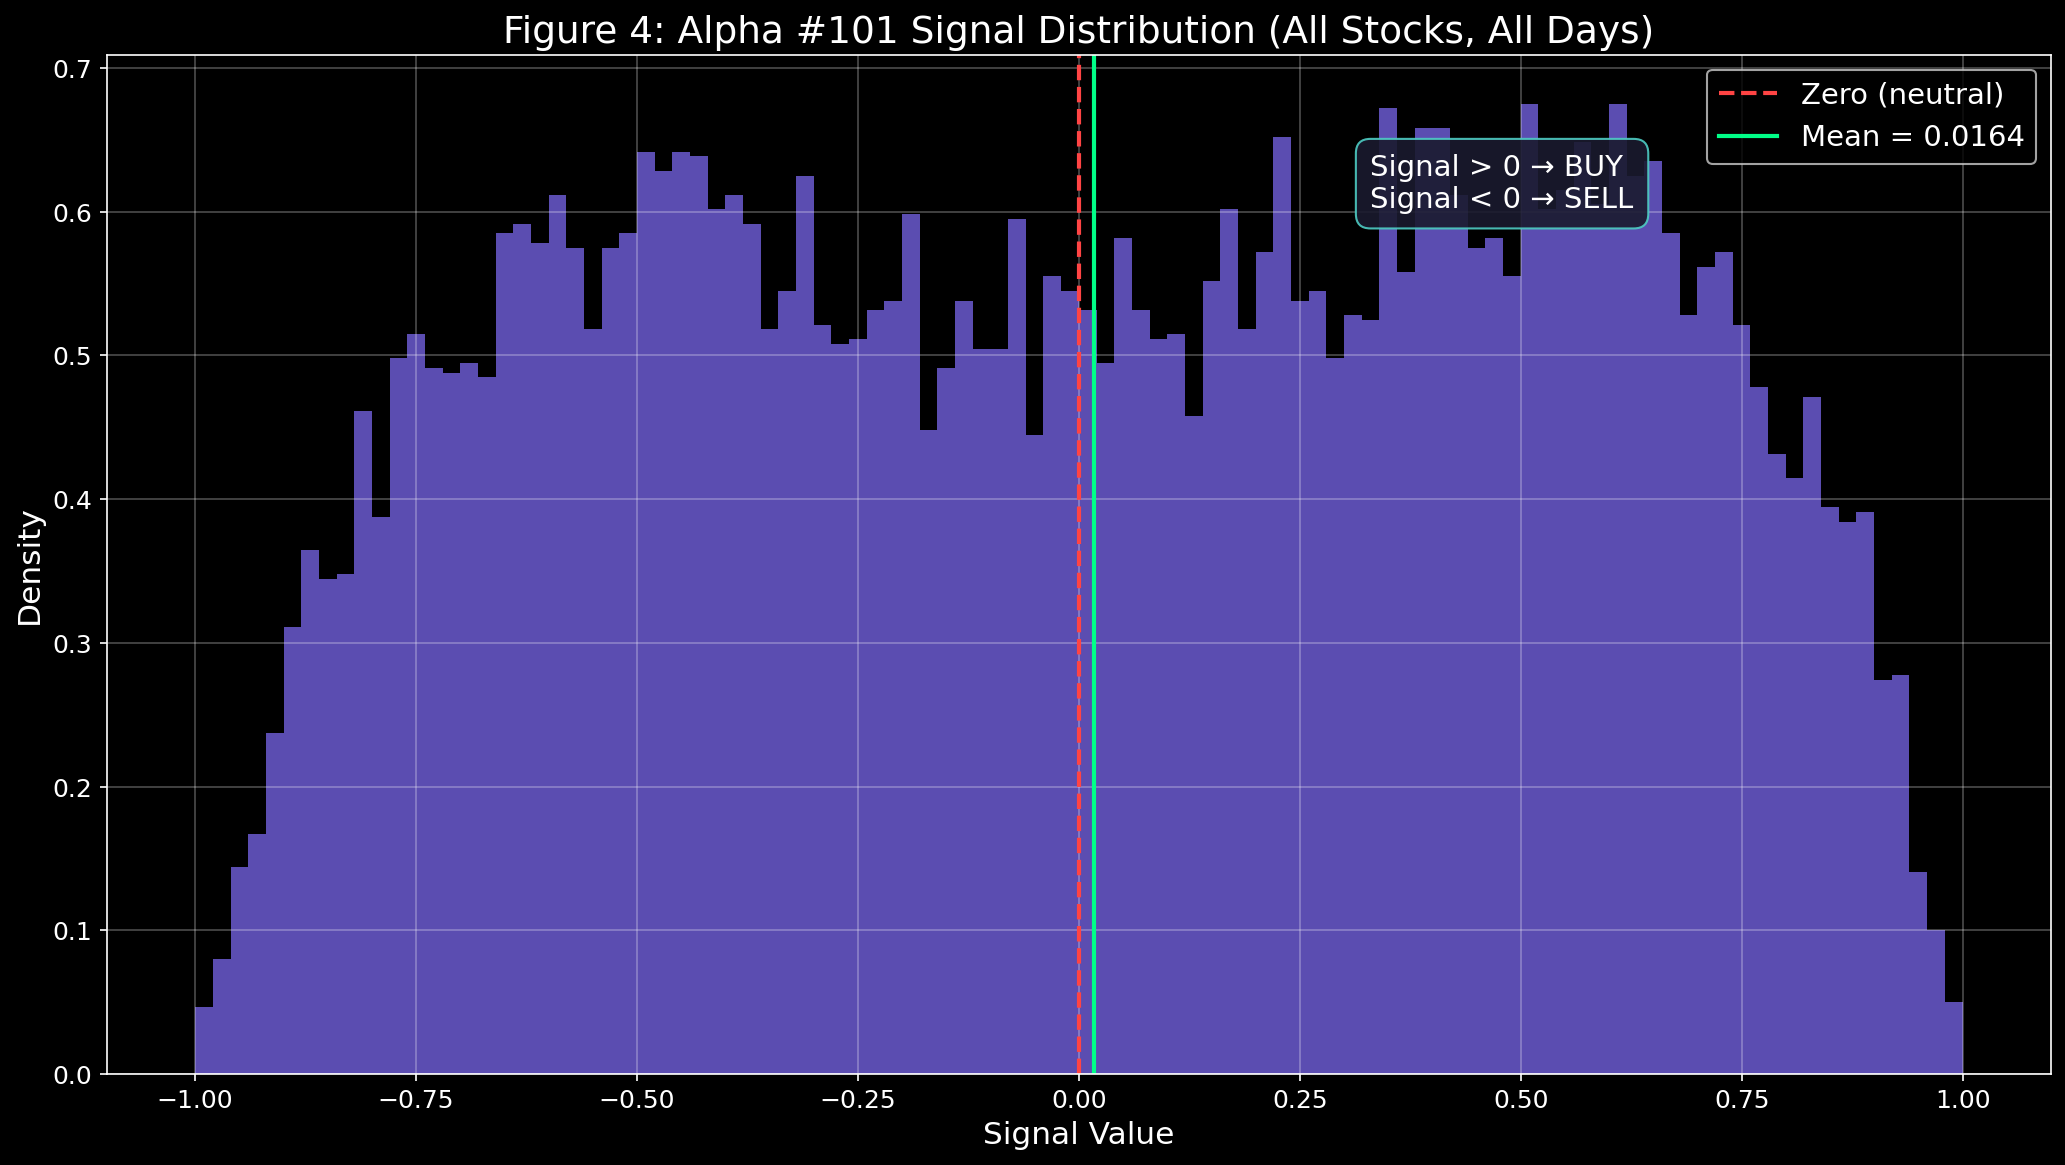
Applying the signal to 30 stocks over ~500 days produces a total of 15,000 alpha signals.
Procedure
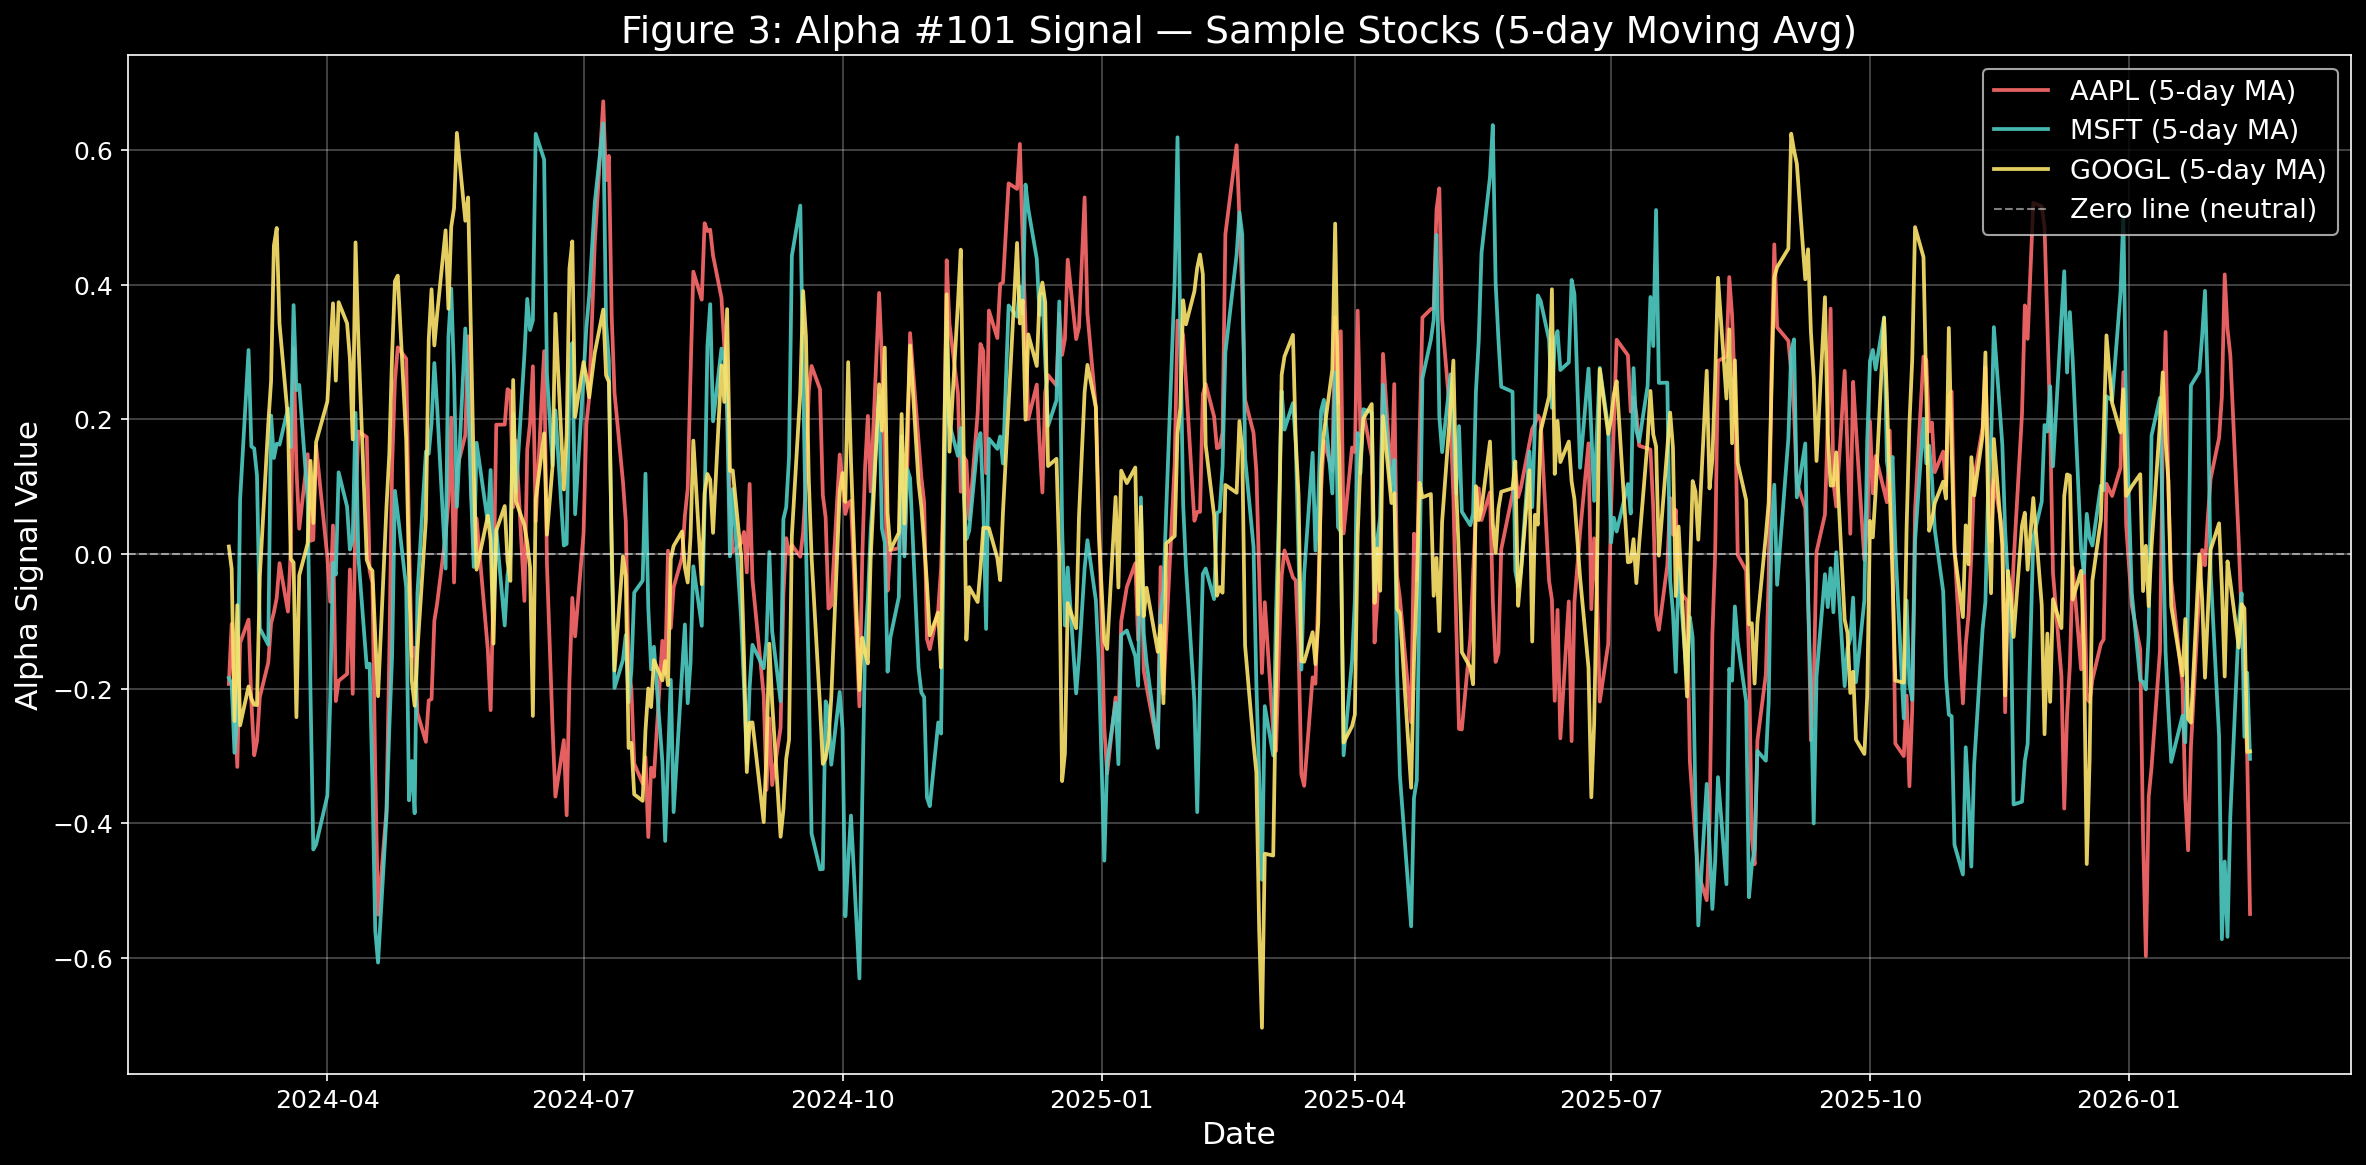
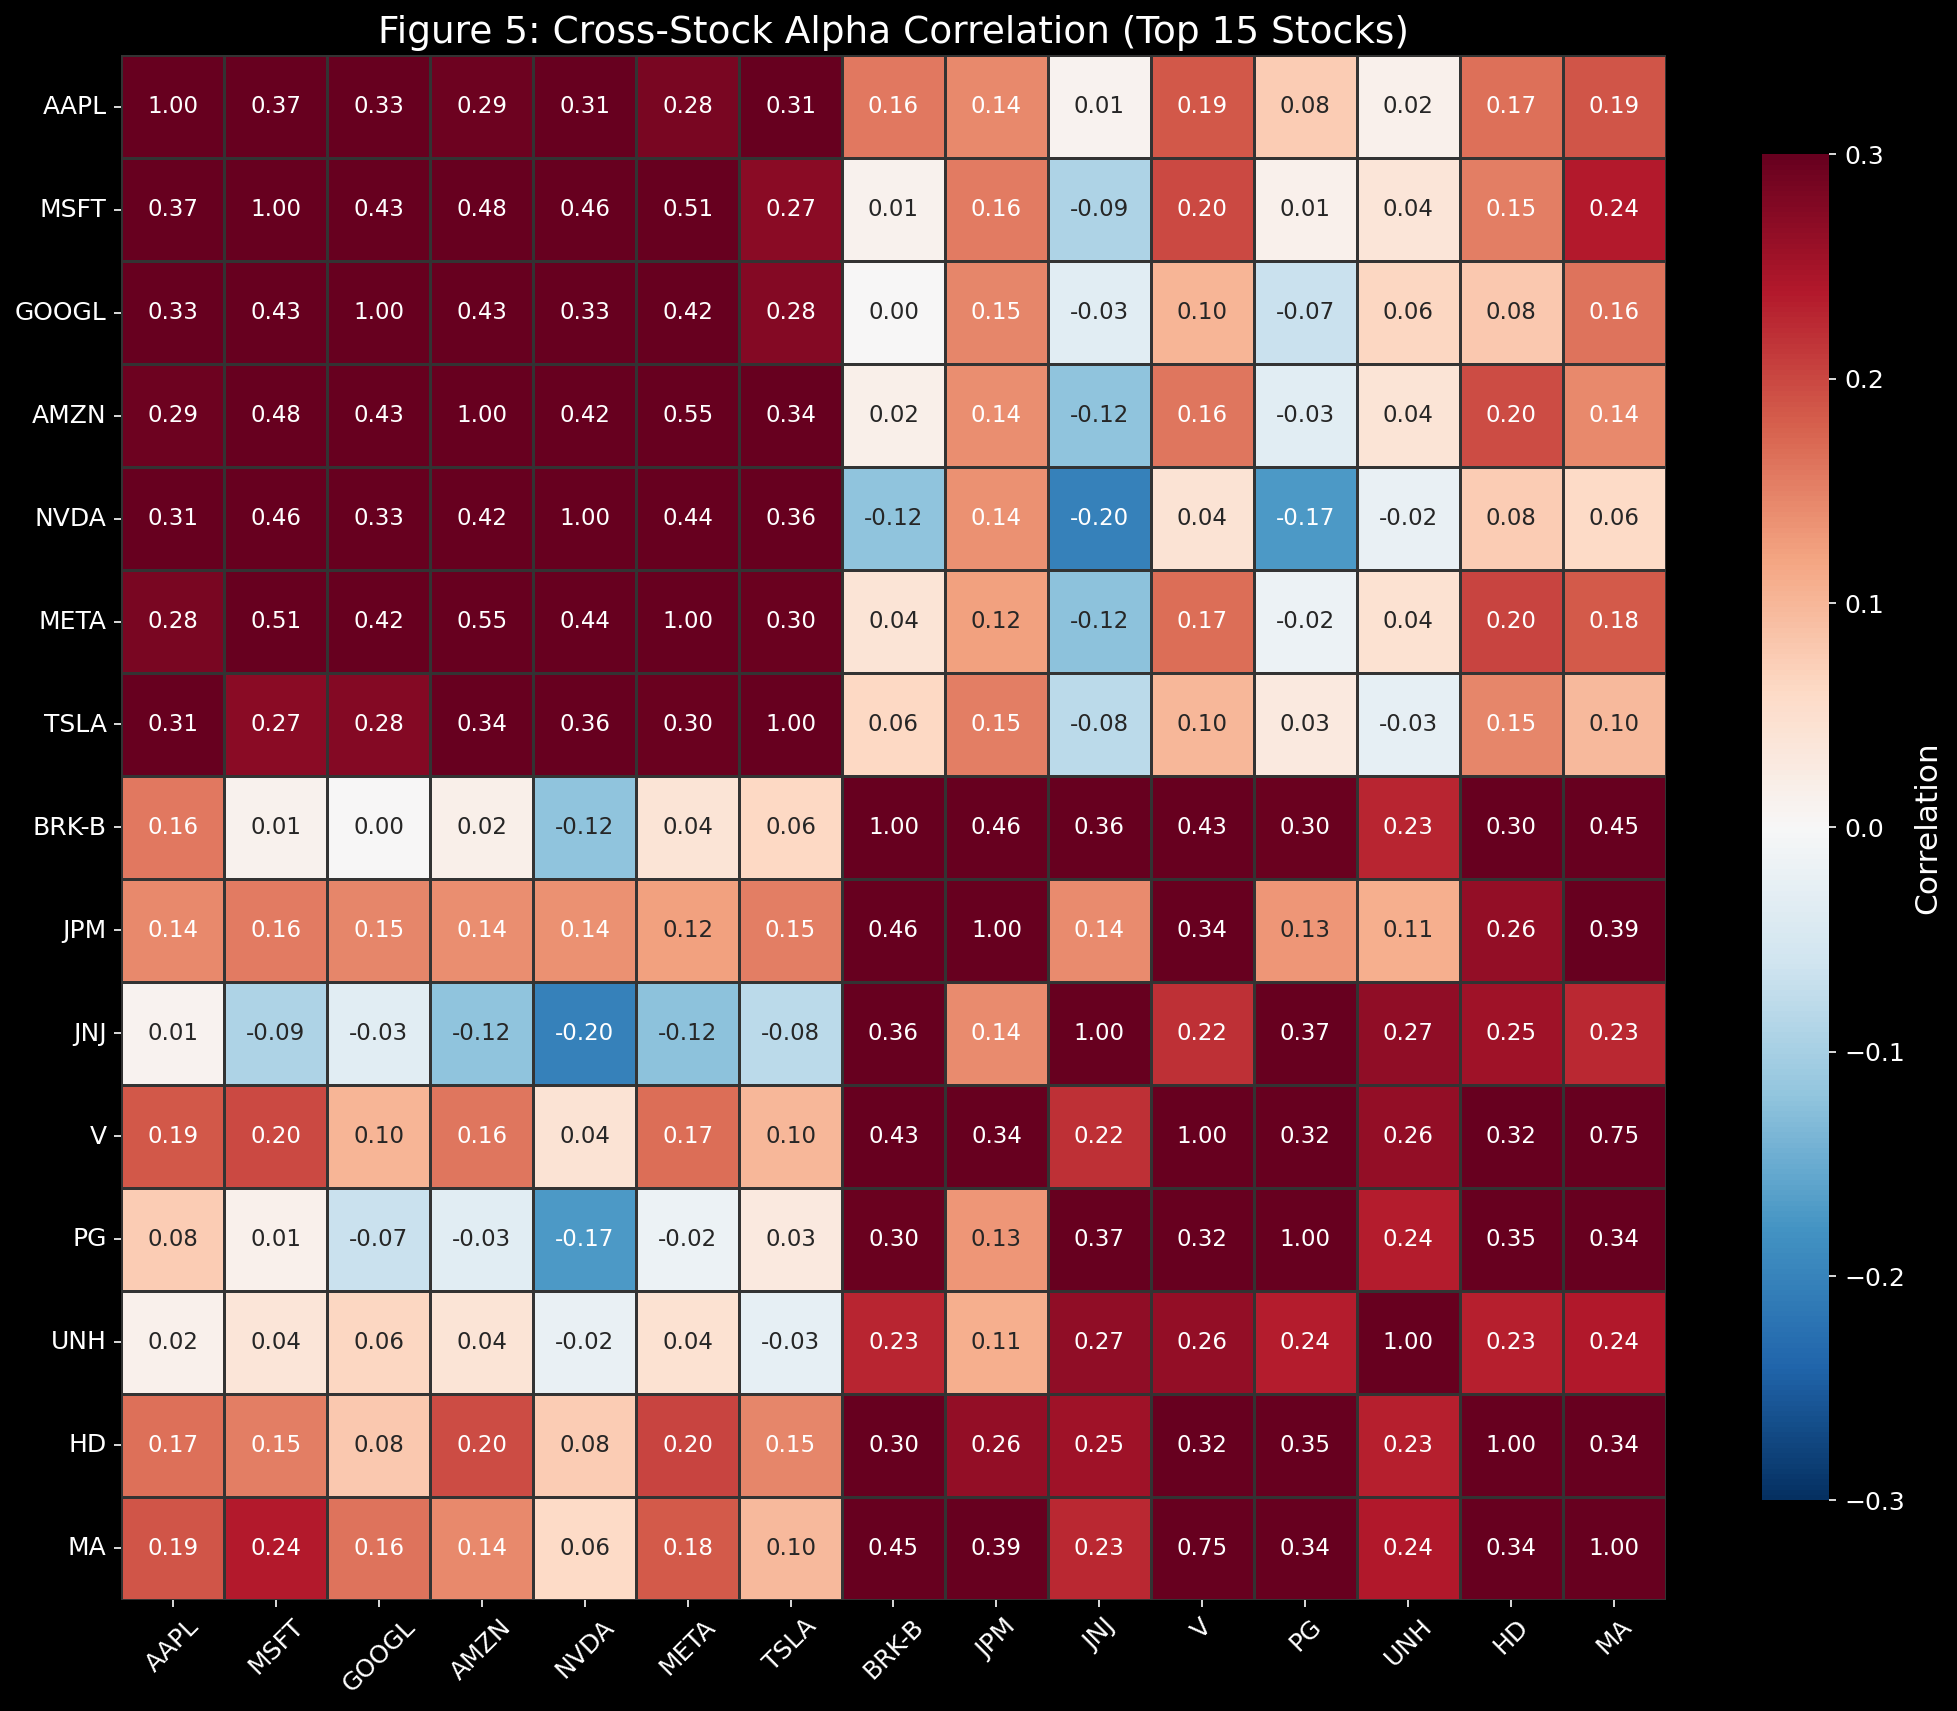
- Compute the alpha signal for each stock and rank them cross-sectionally.
- Since close, high, and low prices are only available after market close, the ranking is applied with a one-day lag.
- Go long the top 50% and short the bottom 50% by rank.
- Calculate the daily portfolio return across all stocks.
- Compound the daily returns to get the cumulative PnL.
Results
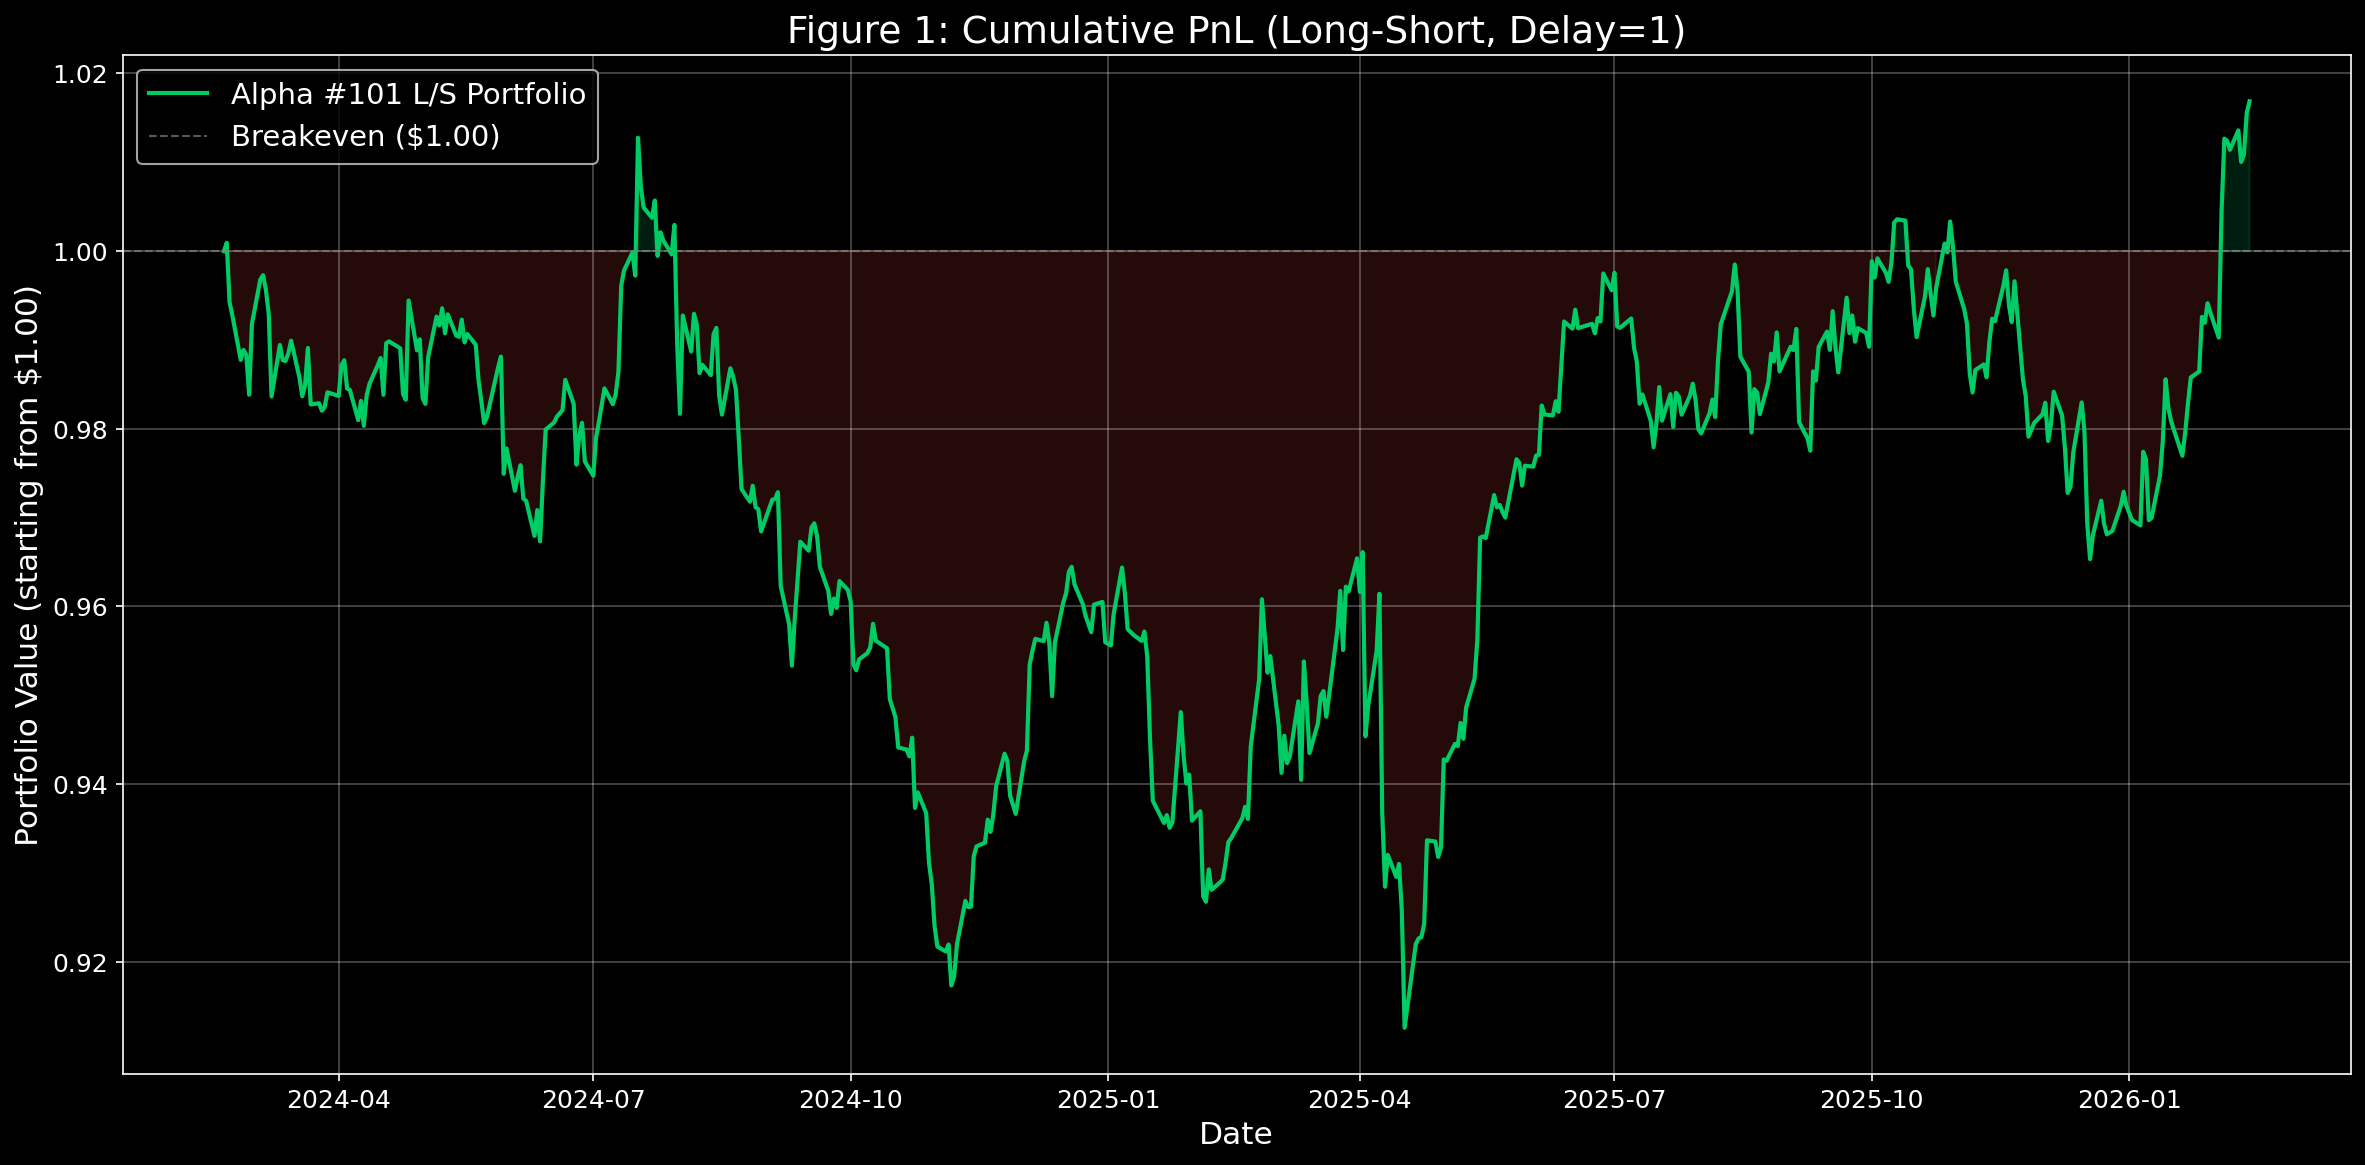
- The starting point of $1 is the break-even line.
- PnL = Profit and Loss
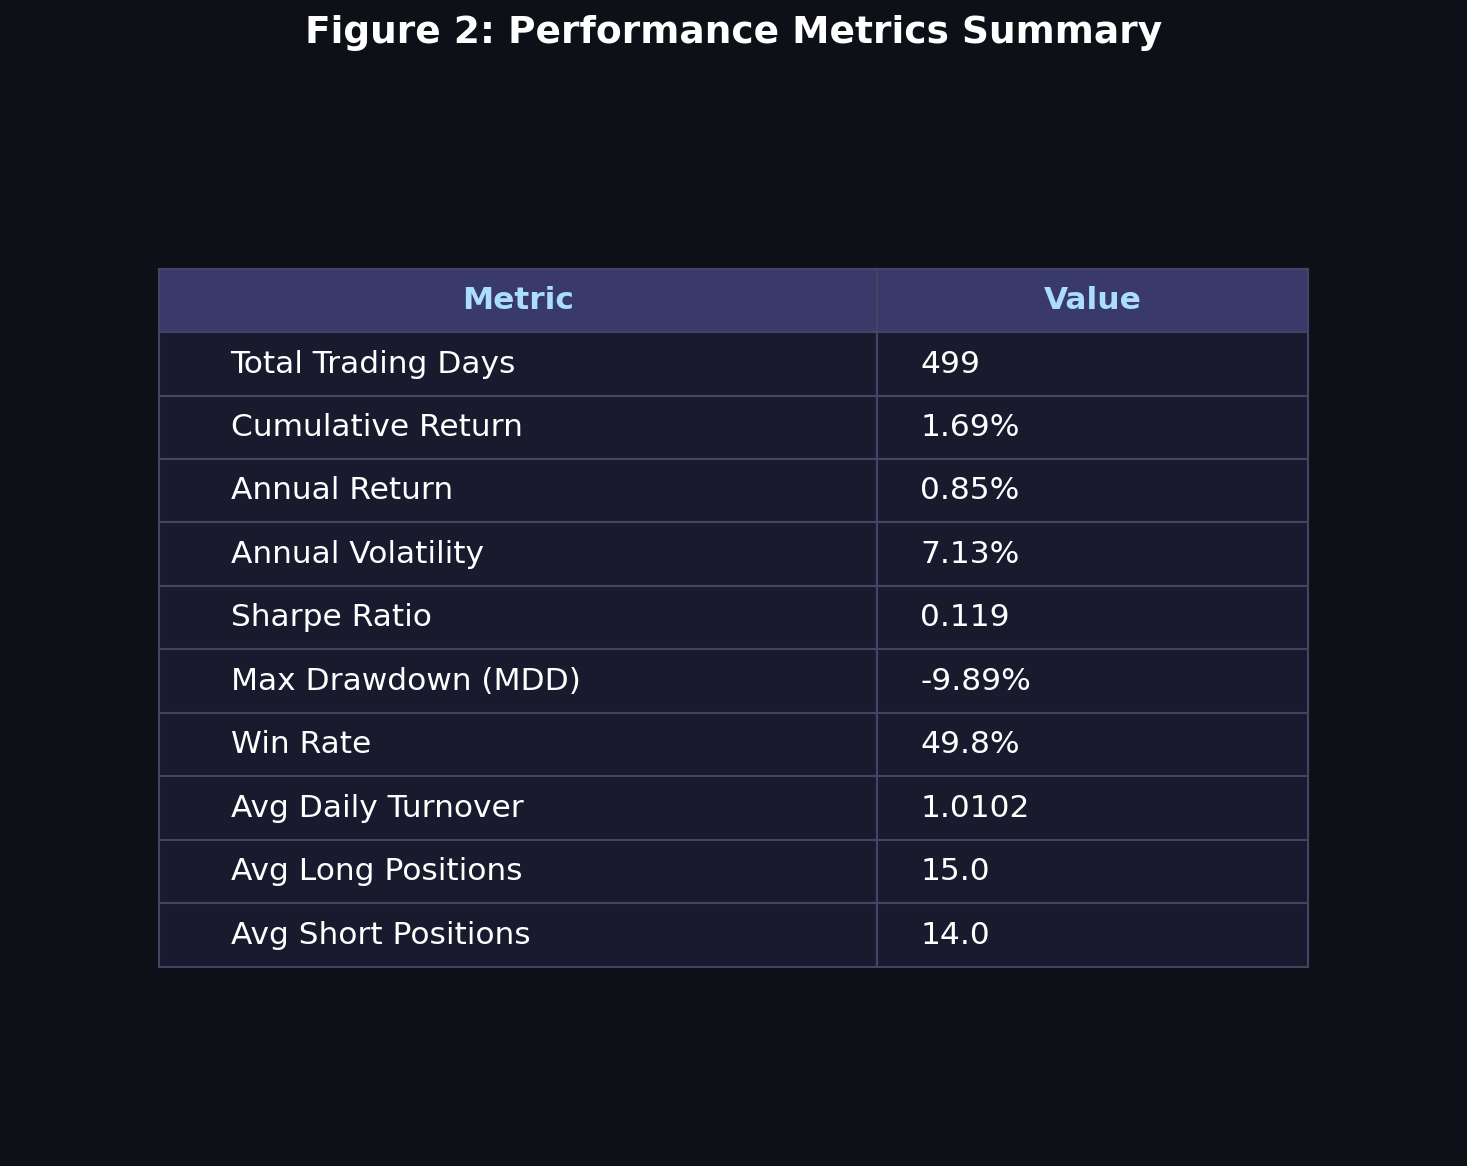
Key Metrics
- Total Return: 1.69% — Quite low, considering bank deposit rates sit around 2–3% annually.
- Annual Volatility — How much the portfolio value fluctuated over the year.
Why Do We Multiply by √N?
This is a fundamental rule in statistics:
\[\sigma_{N\text{-day}} = \sigma_{1\text{-day}} \times \sqrt{N}\]Why not just multiply by N?
Daily volatility: 1%

If we simply multiplied:
→ 252-day volatility = 1% × 252 = 252%  (absurd!)

With the square root:
→ 252-day volatility = 1% × √252 = 1% × 15.87 = 15.87%  (realistic)
The underlying principle:
Daily returns are assumed to be independent. Today’s +1% doesn’t dictate tomorrow’s direction — gains and losses can cancel out over time.
Mathematically:
\[\text{Var}_{N} = N \cdot \sigma^2 \quad \Rightarrow \quad \text{Std}_{N} = \sqrt{N} \cdot \sigma\]Variance scales linearly with $N$; standard deviation scales with $\sqrt{N}$.
Annual Volatility Benchmarks
| Asset | Annual Volatility | Note |
|---|---|---|
| S&P 500 | 15–18% | U.S. large-cap 500 |
| NASDAQ | 20–25% | Tech-heavy, higher swings |
| KOSPI | 18–22% | Korean equity market |
| Bitcoin | 80–120% | Extreme volatility |
| U.S. Treasuries | 3–5% | Very stable |
| Our Strategy | 7.13% | Remarkably low volatility |
Other Metrics
- Sharpe Ratio — Risk-adjusted return:
A Sharpe above 1.0 is considered good; above 2.0 is excellent. Our result of 0.119 is very poor.
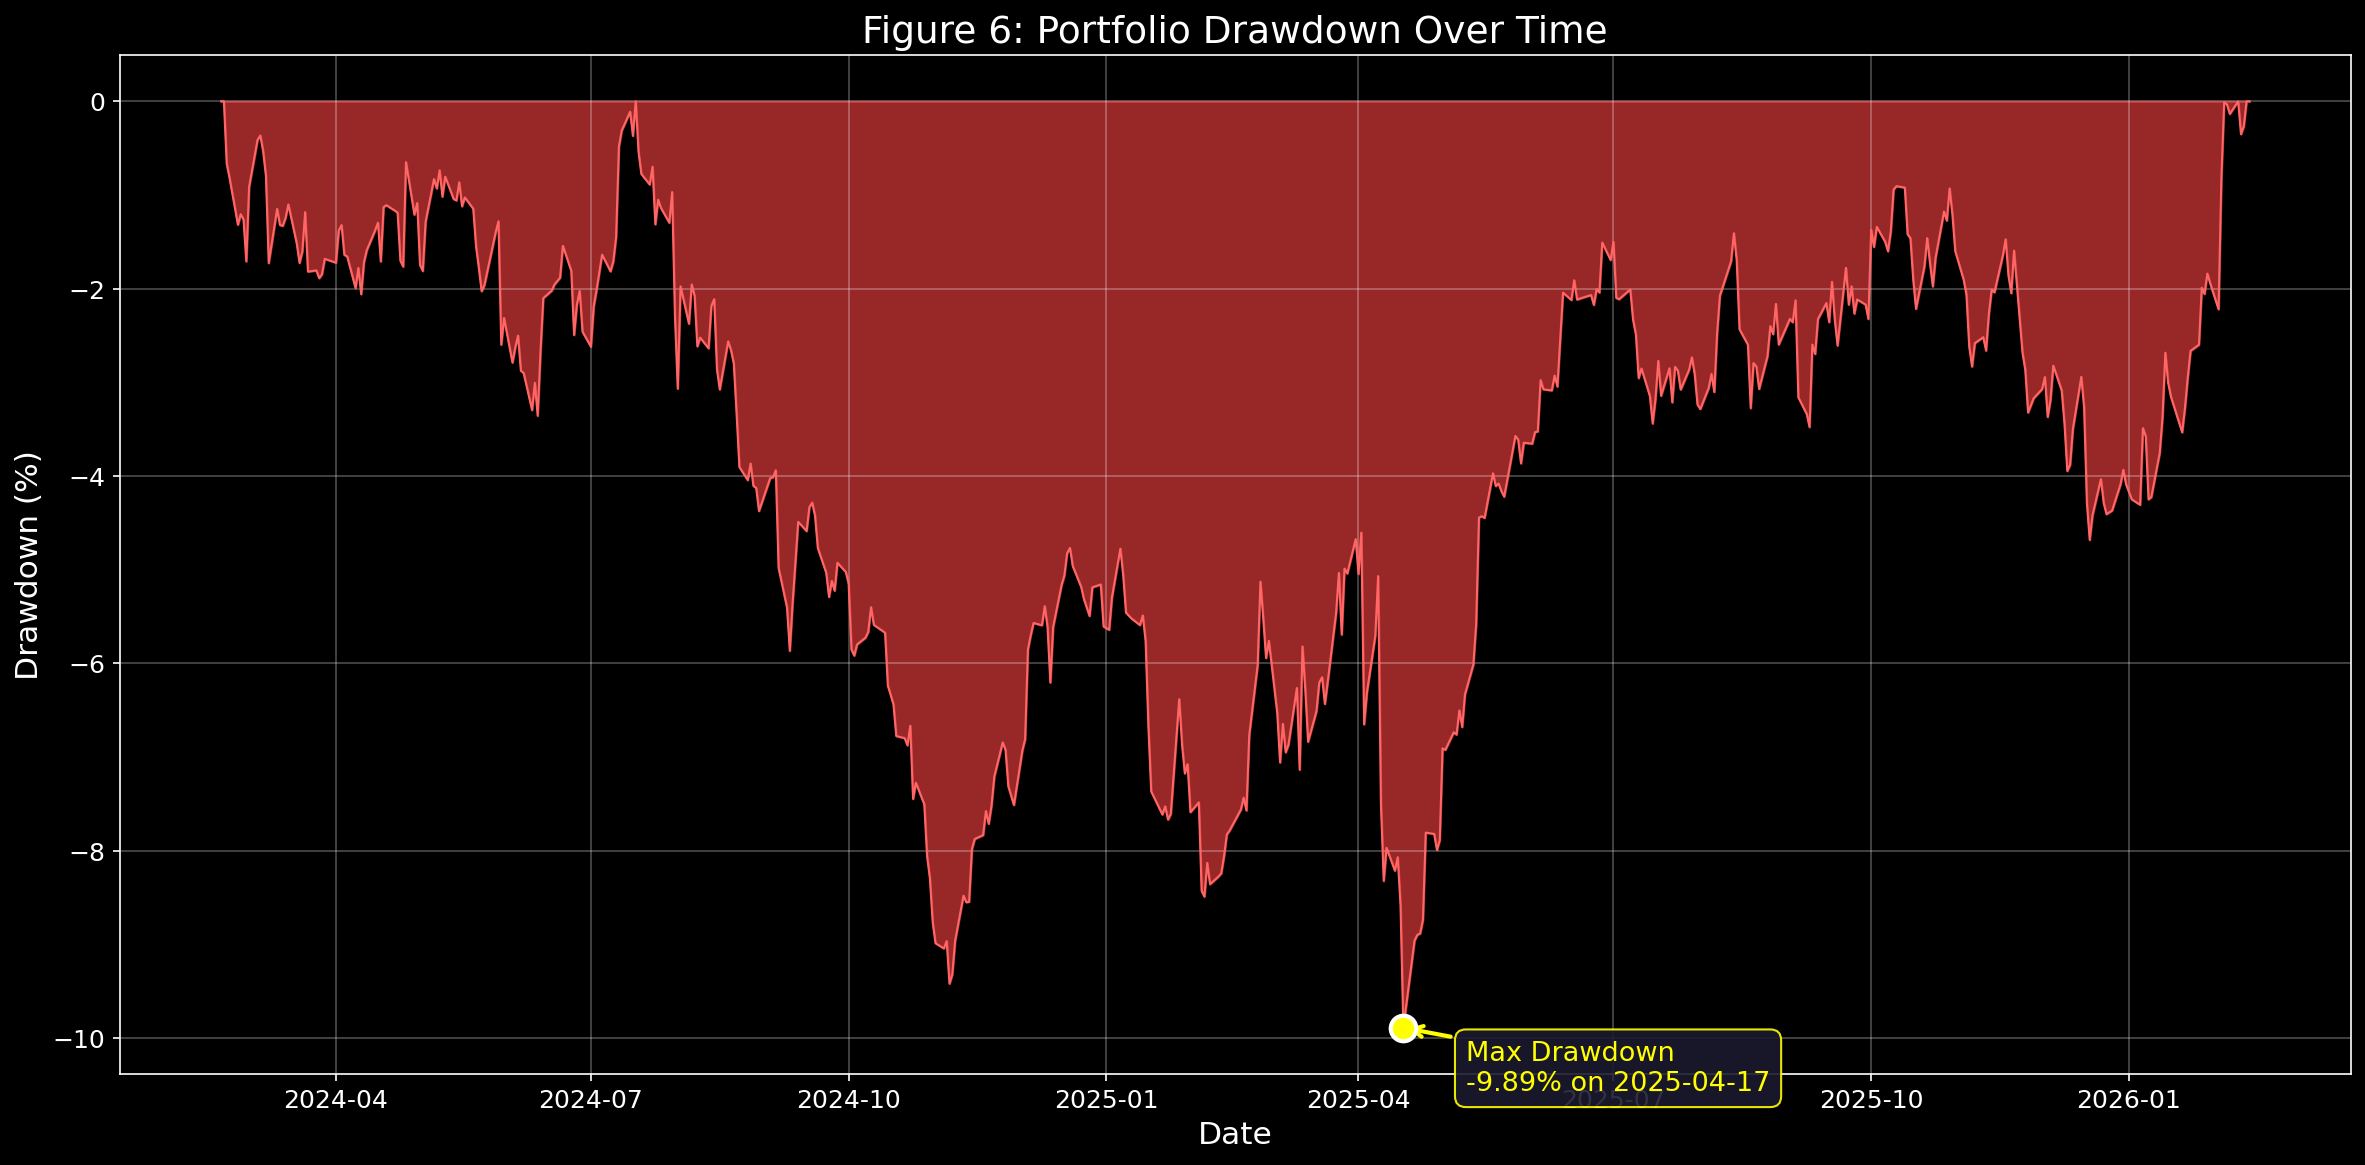
- Max Drawdown — The largest peak-to-trough decline in portfolio value.
- Win Rate — Percentage of trading days with a positive return.
- Avg Daily Turnover — How much of the portfolio is reshuffled each day.
- A value of 1.01 means we traded ~101% of the portfolio’s value daily. Higher turnover = higher transaction costs.
- Avg Long / Short Positions — The average number of stocks held long vs. sold short on any given day.
Disclaimer: This post is purely a study note. All investment decisions should be made based on your own research and judgment.
댓글남기기